


Most grooming salon KPI dashboards are useless. They track 47 different metrics, generate pretty graphs nobody looks at, and fail to answer the only question that matters: what needs fixing right now?
Having worked with dozens of grooming salons on operational software, the pattern is pretty consistent. Owners either drown in data or fly completely blind. The ones tracking everything can't identify what actually drives profit. The ones tracking nothing discover problems after they've already cost thousands.
You need exactly six metrics on your grooming salon KPI dashboard. Not revenue — that's an outcome. Not customer satisfaction scores — too vague. Six operational indicators that predict problems before they hit your bank account.
The Six Metrics That Actually Drive Grooming Salon Performance
Forget vanity metrics. These six numbers tell you whether your salon runs profitably or quietly bleeds money through operational gaps.
1. Utilization Rate Per Groomer This isn't just appointments divided by available slots. Real utilization tracks billable minutes against paid hours. A groomer working 8 hours with 5 appointments might show 62% slot utilization but only 41% time utilization if those appointments average 65 minutes each. Target range: 68-78% time utilization Alert trigger: Below 65% or above 82% Decision point: Adjust booking density or service mix
2. Rebook Rate at Checkout Not the percentage who eventually come back. The percentage who schedule their next appointment before leaving. This single metric predicts revenue stability better than any customer satisfaction survey. Target: 45% minimum Alert trigger: Below 40% for two consecutive weeks Decision point: Implement checkout scripting or booking incentives
3. Service Time Variance Track actual grooming time versus scheduled time by service type. When a "standard groom" scheduled for 90 minutes consistently takes 115 minutes, your entire day compounds into chaos. Target: Within 12% of scheduled time Alert trigger: 20% variance sustained over 5 days Decision point: Revise time estimates or groomer assignments
4. Daily Cash Position vs Bookings Compare collected revenue to expected revenue from completed appointments. This catches payment processing delays, forgotten charges, and register errors before month-end reconciliation. Target: 96% collection rate same-day Alert trigger: Below 92% any single day Decision point: Review payment procedures or investigate discrepancies
5. Product Attachment Rate Percentage of grooming appointments that include any retail sale. Not average ticket size, which fluctuates seasonally. Pure attachment shows whether your team is actively offering products. Target: 28% minimum Alert trigger: Below 22% for a week Decision point: Refresh product placement or incentive structure
6. Same-Week Cancellation Rate Cancellations within 7 days of appointment time. Last-minute cancellations destroy utilization, while advance cancellations can usually be refilled. This metric isolates the costly ones. Target: Under 8% Alert trigger: Above 12% any rolling 7-day period Decision point: Tighten cancellation policy or adjust confirmation sequence
These six metrics are operational indicators that predict problems before they hit profitability. Track them daily and use the triggers to drive action.
Building Your Minimal Monitoring Dashboard
Physical dashboards work better than digital ones for most grooming salons. A whiteboard in the break room gets checked. A login-required analytics platform gets ignored.
Never miss a grooming appointment again.
Furlyly helps you book, confirm, and manage every pet grooming appointment effortlessly.
- Unified appointment scheduling
- Automated client reminders
- Staff availability & shift management
No credit card required
Here's the exact layout that drives action:
Morning Snapshot Board (updated at 9 AM)
-
Yesterday's utilization by groomer (percentage)
-
Week-to-date rebook rate (percentage)
-
Yesterday's variance incidents (count)
-
Week-to-date same-week cancellations (count)
Afternoon Check (updated at 2 PM)
-
Current day utilization projection
-
Morning collection rate
-
Product attachments so far today
Weekly Review Grid (updated Mondays)
| Metric | Previous Week | Target | Status | Action Required |
|---|---|---|---|---|
| Utilization | 71% | 68-78% | ✓ | None |
| Rebook Rate | 38% | 45%+ | ⚠️ | Review checkout process |
| Time Variance | 24% | <12% | ❌ | Audit scheduling templates |
| Collection | 94% | 96%+ | ⚠️ | Check payment logs |
| Attachment | 31% | 28%+ | ✓ | None |
| Cancellations | 6% | <8% | ✓ | None |
The physical board creates accountability. Staff see the numbers. They understand what drives them. Problems become visible before they compound.
Here's a quick visual workflow of how the morning snapshot, afternoon check, and weekly review connect to appointments, checkout, variance detection, collections, and product attachment.
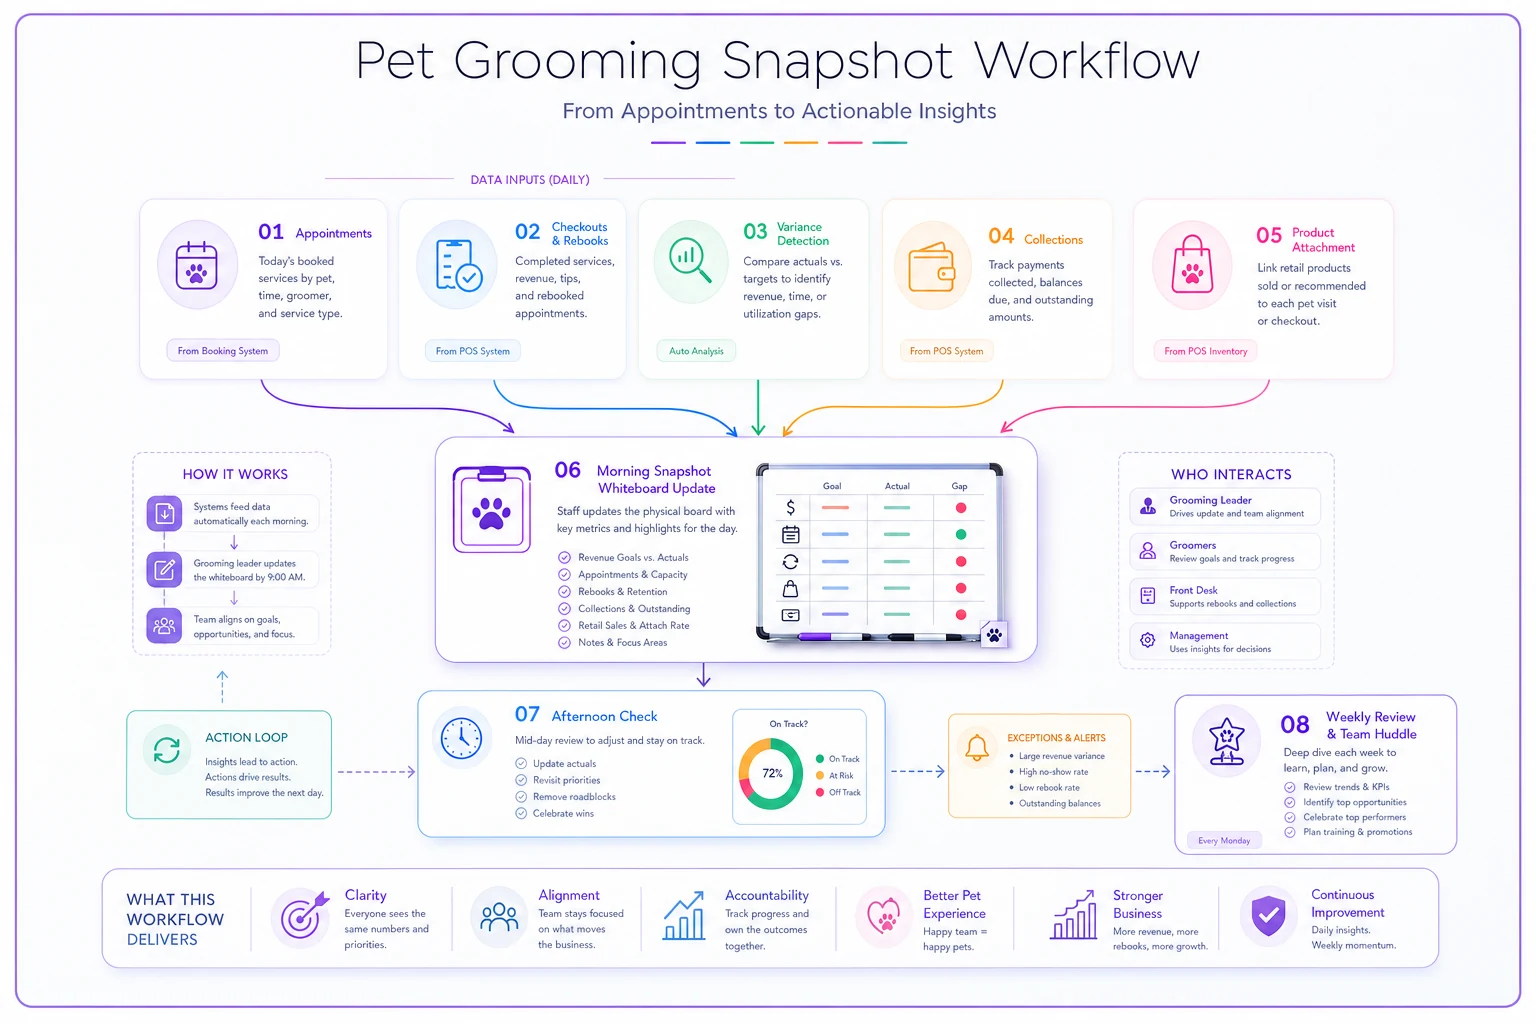
Use the visual to show staff how data becomes decisions and where each metric is updated.
Alert Triggers and Response Playbooks
Metrics without action protocols are just decoration. Each trigger needs a specific response pathway, not a general "look into it" note.
Utilization Drop Below 65% First, check distribution. Is it one groomer or salon-wide? Single groomer issues usually mean scheduling conflicts or skill mismatches. Salon-wide drops point to booking system problems or a real demand shift.
-
Pull individual schedules for the past 3 days
-
Identify gaps (no-shows vs unfilled slots)
-
If no-shows exceed 15%, activate confirmation protocol
-
If unfilled slots exceed 20%, review booking availability settings
-
Implement same-day discount filling for the remainder of the week
Rebook Rate Under 40% This metric rarely drops without a cause. New staff, rushed checkouts, or pricing concerns typically drive the decline.
-
Observe 5 checkout interactions today
-
Check if specific groomers show lower rebook rates
-
Review recent price changes or service modifications
-
Test offering 10% rebook discount for next 3 days
-
If no improvement, implement mandatory checkout script
Time Variance Exceeding 20% Chronic time overruns cascade through your entire operation. One delayed appointment creates four unhappy customers by day's end.
-
Track which specific services are showing variance
-
Compare groomer completion times for identical services
-
Identify if certain breeds consistently run over
-
Adjust default booking times by 15-minute increments
-
Consider dedicated "difficult dog" time blocks
The key is that response playbooks need to be specific enough that any manager can execute them without interpretation.
The 6-Week Reporting Cadence
Daily metrics create panic. Monthly metrics hide problems. A 6-week cycle gives you enough data to see real patterns while keeping enough urgency to actually fix things.
Week 1-2: Baseline Establishment Track all six metrics without intervention. Document natural variation. Figure out which metrics are stable versus volatile. This prevents overreacting to normal fluctuations.
Week 3-4: Initial Interventions Implement corrections for any metric outside target range for 5+ consecutive days. Use the minimal intervention first — a process reminder before a policy change.
Week 5-6: Adjustment and Lock Evaluate whether interventions worked. Successful corrections become permanent procedures. Failed ones get replaced with escalated responses.
6-Week Review Meeting Agenda:
-
Metric performance vs targets (5 minutes)
-
Successful interventions to standardize (10 minutes)
-
Persistent problems requiring system changes (15 minutes)
-
Target adjustments based on seasonal factors (5 minutes)
-
Next cycle focus areas (5 minutes)
This cadence matches how grooming salons actually operate — long enough to show real patterns, short enough to maintain momentum.
Real-World Implementation Roadmap
A shop with 4 groomers and roughly 320 monthly appointments implemented this exact system. Starting metrics showed problems everywhere — 59% utilization, 31% rebook rate, 34% time variance. Revenue was flat despite being "fully booked."
Week 1: Set up the physical dashboard. Nothing digital, just a whiteboard with permanent marker grids and dry-erase numbers. Assigned the newest team member to update it each morning — gave them ownership while teaching them the business.
Week 2: Started tracking without commentary. Numbers were rough, but no blame or panic. Just observation. The team started asking about the metrics on their own.
Week 3: First intervention — adjusted booking templates based on actual service times. Added 15 minutes to full grooms, removed 10 from bath-only services. Time variance dropped to 18% almost immediately.
Week 4: Addressed rebook rates. Turned out the newest groomer had never been trained to mention rebooking at checkout — nobody had told them to. A simple checkout script brought the rate up to 42%.
Week 5: Tackled utilization. Morning slots were staying empty while afternoons overflowed. Offered 15% off 8 AM appointments. Utilization hit 70%.
Week 6: Locked in the changes that worked. Wrote out procedures for scheduling adjustments and checkout conversations. Metrics held steady without daily management.
Result after 6 weeks: Revenue increased roughly $8,400 monthly with the same staff and hours. No price increases, no new services. Just operational gaps the metrics made visible.
Common Dashboard Mistakes That Destroy Effectiveness
Overcomplicating the metrics. Average service revenue per square foot might sound sophisticated, but it won't trigger useful action. Stick to metrics that connect directly to fixable problems.
Tracking without triggers. A metric without a defined "good" and "bad" range is just a number. Every metric needs clear boundaries that demand a response.
Digital-only dashboards. Expensive analytics software becomes background noise within two weeks. Physical boards in common areas create unavoidable accountability.
Changing targets too frequently. Metrics need at least 6 weeks to show real patterns. Adjusting targets monthly means you're reacting to noise, not signals.
Ignoring seasonal reality. December rebook rates won't match April rates. Build seasonal adjustment factors rather than treating every month identically.
Avoid these mistakes and your minimal dashboard will remain effective instead of becoming another ignored task.
Making Reports Drive Decisions, Not Just Document History
The difference between a useless report and an actionable dashboard comes down to decision architecture. Each metric has to connect to a specific decision with defined options.
Utilization below target doesn't trigger a vague "increase bookings" goal. It triggers a specific choice: adjust schedule templates, modify service offerings, or change staffing levels. The metric defines the problem, the threshold triggers attention, and the playbook provides options.
This is where tracking customer lifecycle patterns becomes important. A drop in rebook rates might look like a checkout problem, but lifecycle data could reveal you're losing customers consistently at the 6-month mark.
Product attachment rates connect to inventory decisions the same way. Below-target attachment might mean product display changes — or it might signal that your retail selection doesn't match your service clientele. The metrics work together rather than in isolation.
Modern Tools That Support (Not Replace) Your KPI System
A minimal grooming salon KPI dashboard doesn't mean avoiding technology. It means using automation to gather data while keeping human judgment for the actual decisions.
Modern operational platforms can track these metrics automatically — pulling appointment completion times, payment status, and rebooking data without manual counting. The software handles calculation and pattern detection, which honestly is where most of the time gets wasted in manual tracking systems.
AI-powered operational platforms are particularly useful for variance tracking. Instead of manually comparing scheduled versus actual times, the system flags patterns automatically. When golden retrievers consistently run 20 minutes over scheduled time, it suggests template adjustments. When Thursday afternoons show higher cancellation rates, it surfaces that for investigation rather than burying it in a spreadsheet.
The goal is using operational software to eliminate data entry, not thinking. Good systems present the six metrics clearly, flag violations immediately, and maintain historical patterns for comparison. Some platforms now monitor these patterns continuously and only send alerts when metrics drift outside normal variation — which prevents alert fatigue while making sure nothing important slips through unnoticed.
The Maintenance Reality Nobody Discusses
Week 3, someone forgets to update the board. Week 5, you stop reviewing the playbooks. Week 8, you're back to flying blind.
Minimal dashboards require minimal maintenance, but not zero. Assign metric ownership to specific people. The receptionist owns rebook rate. The lead groomer owns utilization. The manager owns collection rate. When metrics have owners, they get tracked.
Assign metric ownership to specific people so metrics get tracked and maintained as part of daily routines.
Build the update process into existing routines. Utilization calculates during morning schedule review. Rebook rate tallies during checkout. Don't create separate "metrics time" — embed tracking into actual work.
Most importantly, respond visibly to the metrics. When utilization drops and you adjust schedules, say out loud that you're doing it because of what the number showed. When rebook rates improve and you celebrate, credit the tracking. The team needs to see that these numbers drive real decisions, otherwise it becomes another ignored process within a month.
Moving from Reactive to Predictive Operations
A minimal grooming salon KPI dashboard isn't about having less information. It's about having the right information at the right time to make the right call.
These six metrics predict problems before they damage profitability. Utilization drops warn of revenue shortfalls. Rebook declines predict future empty slots. Variance patterns reveal scheduling dysfunction. Collection gaps indicate payment process failures. Attachment rates expose missed revenue. Cancellation spikes demand policy examination.
Combined with revenue forecasting models, these operational metrics create a complete picture of salon health. You know what's coming (forecast), what's happening (metrics), and what needs fixing (triggers).
The shops that thrive don't track more metrics. They track the right ones, respond consistently, and adjust based on patterns rather than panic. Their dashboards don't impress anyone with complexity. They just drive daily decisions that compound into sustainable profitability.
Start with the six. Build the board. Define the triggers. Create the playbooks. Because in grooming salon operations, you don't need more data. You need better decisions.
Ready to streamline your grooming business?
Join 500+ pet groomers using Furlyly to save time, reduce scheduling conflicts, and deliver exceptional client experiences.