

Most grooming salons run blind until month-end. You see bookings on the calendar, but can't predict if you'll hit $18k or $24k in revenue. Can't tell if you're overstaffed next Thursday. Can't figure out when to reorder shampoo without either running out or hoarding supplies.
The disconnect between bookings and actual revenue kills planning. A full calendar doesn't mean profitable operations when you can't predict retail attachments, calculate true labor costs, or anticipate supply needs. You're basically guessing at three critical business metrics while trying to maintain healthy margins.
Building a grooming revenue forecast template doesn't require complex software. A well-structured spreadsheet that maps bookings to revenue, tracks attachment rates, calculates payroll requirements, and triggers reorder points gives you the visibility you need. The key is connecting these pieces with formulas that reflect your actual operational patterns.
But most salons never connect these dots. They track appointments in one system, revenue in another, and supplies through guesswork. This creates blind spots that cost money daily.
The Hidden Revenue Sitting in Your Historical Data
Your past three months of appointments contain patterns you're not seeing. Every grooming salon generates predictable ratios between service types, retail attachments, and supply consumption - but these patterns stay buried in disconnected systems.
Take a typical 4-groomer salon doing around 340 appointments monthly. The appointment book shows services scheduled. The POS tracks what actually sold. Payroll records hours worked. Inventory logs show supply usage. But nobody connects these data points to see that Standard Grooms convert to Full Grooms at 22% when offered properly, or that nail grinding attachments jump to 45% on Saturdays.
The problem compounds when you realize these patterns directly impact cash flow. A salon averaging $65 per standard groom might actually generate $78 when you factor in typical add-ons - but only if staff consistently offer them. Without tracking attachment rates by service type, day of week, and groomer, you're leaving thousands on the table monthly.
Historical data also reveals supply burn rates that most salons completely miss. That 300-appointment month consumed 47 gallons of shampoo, 31 bottles of conditioner, and 890 blade sanitizing wipes. But without linking consumption to appointment volume and service mix, you're either panic-ordering when supplies run low or tying up cash in excess inventory.
Pull your POS reports for the last quarter. Look for the patterns hiding in the noise. You'll be surprised what's been there all along.
Mapping Service Mix to Base Revenue
Start with your appointment types and their revenue potential. Most salons offer 5-7 core services, each with different pricing and time requirements. Your forecast accuracy depends on understanding the actual mix, not assumed averages.
Never miss a grooming appointment again.
Furlyly helps you book, confirm, and manage every pet grooming appointment effortlessly.
- Unified appointment scheduling
- Automated client reminders
- Staff availability & shift management
No credit card required
Service types typically break down like this across most salons: Bath & Tidy takes 15% of appointments at $35 average ticket, Standard Groom represents 48% at $65 average, Full Groom accounts for 27% at $85 average, Specialty Cuts handle 7% at $95 average, and Express Services cover the remaining 3% at $25 average.
These percentages shift predictably. December sees Full Grooms jump to 35% for holiday photos. August drops to 20% as people opt for shorter summer cuts. Spring brings more Bath & Tidy requests for shedding season.
Build your spreadsheet with columns for each service type and rows for each week. Don't use monthly averages - weekly granularity catches scheduling gaps and demand surges that monthly views hide. Enter your booked appointments by type, then multiply by average ticket price for base revenue.
But base revenue is just the starting point. A 40-appointment week of Standard Grooms shows $2,600 in base revenue. Actual revenue lands between $2,900 and $3,400 depending on attachment rates and upsells. The difference between hoping for the higher number and systematically achieving it comes down to tracking conversion patterns.
Your spreadsheet formula should look like:
(Appointments × Base Price) + (Appointments × Attachment Rate × Attachment Price)
This transforms vague revenue hopes into predictable outcomes. The math is straightforward once you start tracking the right variables.
The Attachment Rate Multiplier Most Salons Ignore
Retail attachments and service add-ons generate 18-35% of grooming revenue, yet most salons treat them as random bonuses instead of predictable income streams. Every appointment has attachment potential that follows patterns.
Common grooming attachments show reliable rates. Nail grinding upgrades attach at 28% with $8 addition. Teeth cleaning hits 12% at $15 addition. De-shedding treatment reaches 19% with $20 addition. Flea/tick shampoo attaches at 8% for $12 addition. Paw balm application runs 23% at $6 addition. Retail product sales achieve 31% attachment at $18 average.
These rates vary by groomer, day, and service type. Your senior groomer might hit 42% on nail grinding because she explains the benefits clearly. Saturday appointments show higher retail attachment because owners have time to browse. Full Groom clients accept add-ons at nearly double the rate of Bath & Tidy customers.
Track attachment rates weekly by groomer and service type. Create a simple grid:
| Groomer | Week | Nail Grind % | Teeth % | Retail % | Total Attach Revenue |
|---|---|---|---|---|---|
| Sarah | Week 1 | 31% | 14% | 28% | $487 |
| Mike | Week 1 | 24% | 8% | 35% | $412 |
| Lisa | Week 1 | 38% | 11% | 22% | $445 |
After four weeks, you'll see individual patterns. Sarah consistently outperforms on nail grinding. Mike excels at retail. Lisa needs coaching on teeth cleaning conversations. More importantly, you can now forecast attachment revenue based on who's working.
Apply these rates to your booking forecast. If next week shows 85 appointments with Sarah handling 30 of them, you can predict roughly $145 in nail grinding upgrades from her appointments alone (30 appointments × 31% attachment × $15 average).
The data tells a story once you start collecting it systematically.
Converting Bookings to Payroll Hours
Labor typically consumes 42-48% of grooming revenue, but most salons calculate payroll after the fact instead of forecasting needs from bookings. Your appointment schedule should drive staffing decisions, not react to them.
Different services require different time investments. Bath & Tidy averages 45 minutes. Standard Groom takes 75 minutes. Full Groom needs 90 minutes. Specialty Cuts require 105 minutes. Express Services run 30 minutes.
But actual grooming time is only part of the equation. Add setup, cleanup, client interaction, and transition time. That 75-minute Standard Groom actually requires 85-90 minutes of paid labor.
Build a payroll forecast that accounts for:
-
Direct service hours
appointments × service duration × 1.15 buffer
-
Support hours including opening/closing at 30 minutes daily per person
-
Cleaning between appointments at 10 minutes per appointment
-
Phone/scheduling at 2 hours daily minimum
-
Inventory/supplies at 3 hours weekly
Efficiency factors complicate the math. New groomers work 25% slower their first 60 days. Difficult breeds add 20% to standard times. Back-to-back bookings save 8% on transitions. Saturday rush reduces efficiency by 15%.
For a week with 95 appointments across 3 groomers, you're looking at 127 direct service hours plus 28 support hours for 155 total payroll hours. At $16-22/hour average, that's $2,480-$3,410 in labor costs.
Compare this to expected revenue from those 95 appointments (including attachments) of roughly $7,200. Labor percentage lands at 34-47% - acceptable if you're at the lower end, problematic if trending higher.
If forecast shows labor hitting 51%, you might consolidate appointments, adjust booking slots, or push certain services to slower periods. The key is making these adjustments before the week starts, not after payroll is already blown.
Supply Burn Rates Tied to Appointment Volume
Supply costs eat 8-12% of revenue, but reordering happens reactively - you notice you're low and rush order, paying premium shipping. Connecting supply consumption to appointment forecasts eliminates emergencies.
Track consumption per appointment type over 30 days. Shampoo usage runs 2.5 oz for Bath & Tidy, 3.5 oz for Standard Groom, 4 oz for Full Groom, with large breeds adding 40% to baseline. Blade sanitizer uses 1 spray per appointment, or 1.5 sprays for shared stations. A 32oz bottle provides approximately 400 sprays.
Basic consumption rates:
-
Ear cleaning pads
2 per appointment
-
Cotton balls
4-6 per appointment
-
Paper towels
8-12 sheets per appointment
-
Blade oil
0.5ml per appointment
Create reorder triggers based on upcoming appointments, not current inventory. If you're booking 85 appointments next week and currently have 180 oz of shampoo, you'll need approximately 297 oz (85 appointments × 3.5 oz average). That 180 oz won't make it through the week.
Set par levels with 10-day buffers. Shampoo needs 10 days of appointments times daily average usage times 1.2 safety factor. Conditioner requires 70% of shampoo volume. Ear cleaner needs 15ml per appointment times 10 days appointments. Blade sanitizer maintains 2 bottles minimum on hand.
Your spreadsheet triggers reorders when projected usage over the next 10 days exceeds current inventory minus buffer. No more emergency supply runs or overstocked storage rooms.
The math is simple once you establish baseline consumption rates. Most salons just never bother to measure.
Building Your Forecast Spreadsheet Step by Step
Start simple. Don't try building a complex model immediately - you'll abandon it within two weeks. Begin with basic booking-to-revenue mapping, then layer in complexity as you gather better data.
Start with the next two weeks of bookings so the model feels immediately useful.
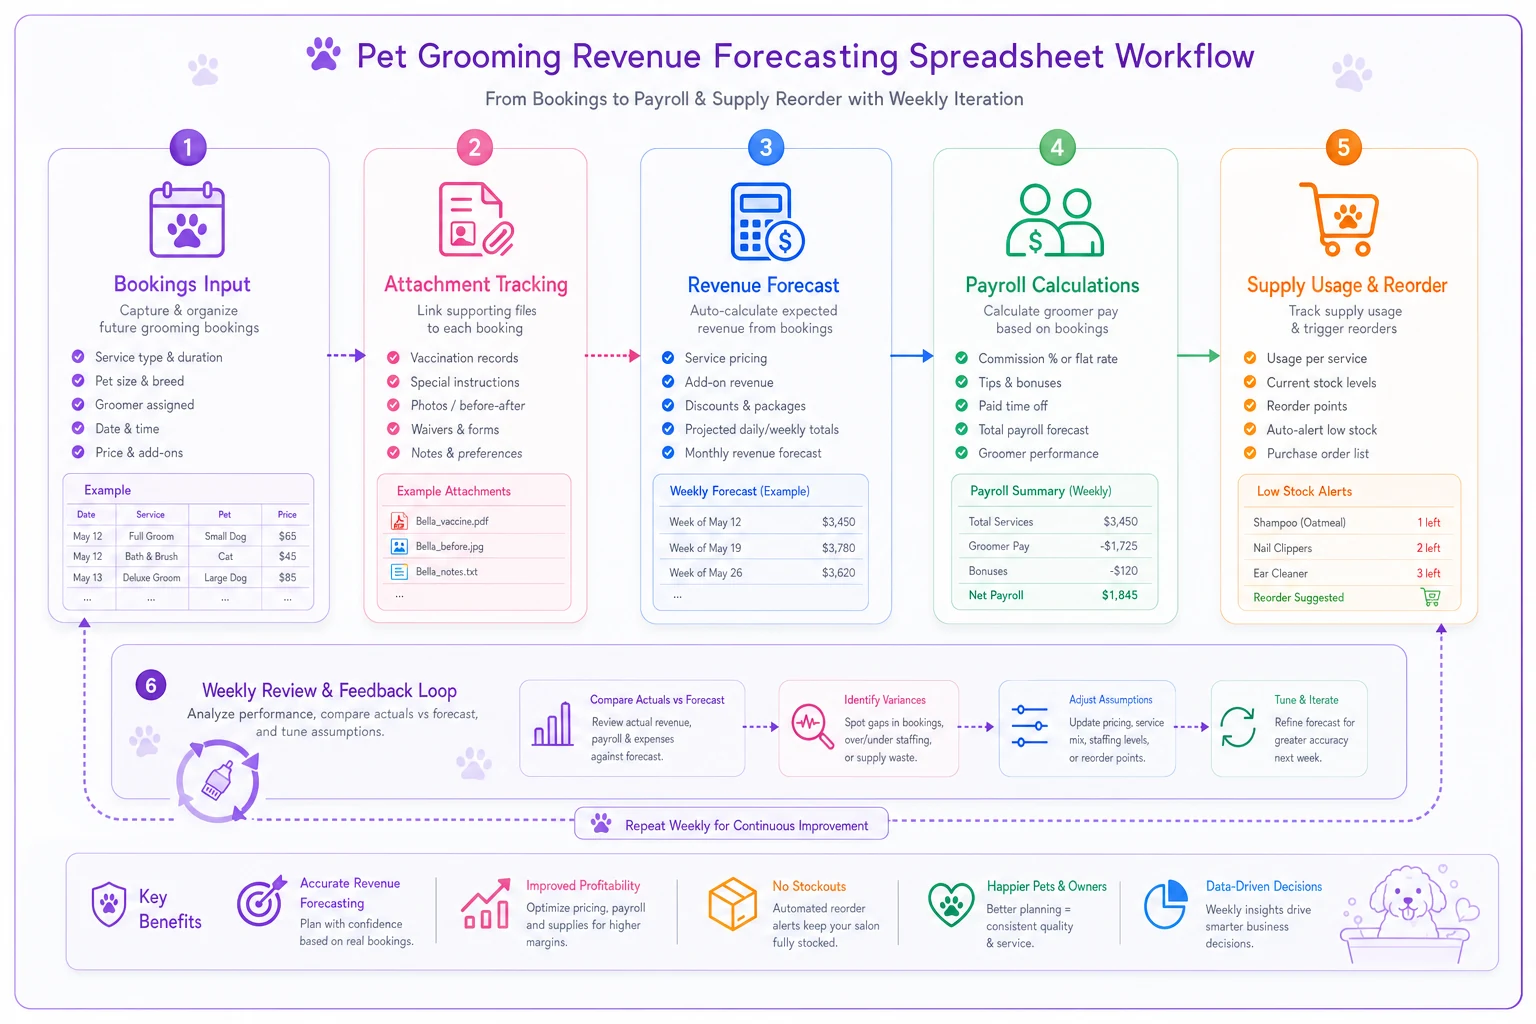
This diagram shows the layered spreadsheet build process and the weekly iteration you should follow.
Week 1-2: Basic Revenue Forecast Create columns for date, service type, number of appointments, base revenue (appointments times average price), and estimated total (base times 1.25 for rough attachment estimate). Enter your next two weeks of bookings. Calculate daily and weekly totals. Compare actual revenue to forecast at week end. You'll probably be off by 15-20% initially.
Week 3-4: Add Attachment Tracking Add columns for each attachment type. Track actual attachment rates daily. Calculate attachment revenue separately. Update your multiplier from generic 1.25 to actual rates. Your forecast accuracy should improve to within 10-12% of actual revenue.
Week 5-6: Layer in Payroll Add labor calculations for service hours by type, support hours, total hours needed, labor cost, and labor as percentage of revenue. This reveals whether busy weeks are actually profitable or just chaotic.
Week 7-8: Include Supply Planning Track supply usage by appointment type, current inventory levels, projected usage next 10 days, reorder triggers, and order quantities needed. Now you're forecasting revenue, planning labor, and managing supplies from one spreadsheet. The complexity builds gradually, so you don't get overwhelmed.
Each layer adds clarity to different parts of your operation. Revenue forecasting shows what's coming. Labor planning prevents overstaffing. Supply tracking eliminates emergencies.
Tuning Your Forecasts with Rolling Averages
Initial forecasts will miss the mark. That's expected. The power comes from continuously refining your assumptions with actual data. Every week provides new information to improve accuracy.
Track variance between forecast and actual. Monday forecast might be $1,850 versus actual $1,720 (-7%). Tuesday forecast could be $2,100 versus actual $2,280 (+8.5%). Wednesday forecast shows $1,950 versus actual $1,990 (+2%).
Look for patterns in your misses. Mondays might consistently underperform because of no-shows. Saturdays might outperform due to walk-in nail trims. Adjust your multipliers accordingly.
Use rolling 4-week averages for stability. Don't react to single-day anomalies. Weight recent weeks more heavily (40%, 30%, 20%, 10%). Separate patterns by day of week. Account for seasonal shifts.
After 8 weeks of tuning, most salons achieve 85-90% forecast accuracy. The data starts revealing operational insights you never noticed before.
Attachment rates improve with specific groomer pairings. When Mike and Sarah work together, retail attachment hits 38%. When Mike works alone, it drops to 31%. The spreadsheet can account for schedule combinations.
Supply usage varies by groomer technique. One groomer might use 20% more shampoo but achieve better coat results that clients notice. Another might be conservative with products but generate more complaints. Balance efficiency with quality.
Weather impacts everything. Rainy weeks see 12% more cancellations but 18% higher retail sales as clients stock up. Snow delays cause appointment compression that burns through supplies faster. Build weather factors into your model.
The patterns emerge once you start looking for them systematically.
When Simple Spreadsheets Hit Their Limits
Spreadsheets work well for single-location operations with under 500 monthly appointments. Beyond that, manual data entry and formula maintenance become overwhelming. You'll spend more time updating the spreadsheet than analyzing insights.
Signs you've outgrown spreadsheet forecasting include data entry taking over 2 hours weekly, formula errors causing planning mistakes, multiple people needing simultaneous access, historical data exceeding manageable rows, and integration with booking system being needed.
This is where operational software becomes valuable. Modern platforms pull appointment data directly from your booking system, calculate forecasts automatically, and alert you to planning issues before they impact operations.
AI-powered operational software particularly excels at pattern recognition across multiple variables. Instead of manually tracking that Tuesday rain correlates with 15% more no-shows, the system identifies these patterns automatically. Instead of remembering that month-end Fridays need extra staff for retail sales, automated scheduling adjusts based on historical patterns.
The transition from spreadsheet to software doesn't mean abandoning your model. Export your spreadsheet logic into an automated system that maintains your business rules while eliminating manual work. Your attachment rate formulas, supply burn calculations, and payroll ratios become automated workflows that run continuously.
You keep the insights you've developed but eliminate the busywork of maintaining spreadsheets manually.
Forecast Accuracy as Competitive Advantage
Running a grooming salon without revenue forecasting is like driving with your eyes closed - you might reach your destination, but it's stressful and inefficient. Salons using even basic forecasting see immediate improvements in cash flow management and operational efficiency.
The spreadsheet framework transforms booking data into actionable intelligence. You'll spot revenue opportunities in attachment patterns. You'll prevent payroll overruns before they happen. You'll eliminate supply emergencies that disrupt operations.
Start with the basic booking-to-revenue mapping this week. Add one new element each week until you have a complete forecasting system. Within two months, you'll wonder how you ever operated without this visibility.
Most importantly, accurate forecasting reduces the daily stress of uncertainty. When you know Tuesday will generate roughly $2,100 with $780 in labor costs and normal supply consumption, you can focus on delivering great grooming instead of worrying about finances.
The compound effect over time is substantial. Salons with functioning forecast models consistently outperform their markets by 15-25% on margins. They make better hiring decisions, optimize their service mix, and maintain healthier cash reserves.
The grooming revenue forecast template you build becomes your operational compass - pointing toward profitable decisions and away from costly mistakes. Every formula you refine, every pattern you identify, and every forecast you improve builds a more resilient and profitable business.
Ready to streamline your grooming business?
Join 500+ pet groomers using Furlyly to save time, reduce scheduling conflicts, and deliver exceptional client experiences.