
Most grooming salons run their pricing like they set it in 2015 and forgot about it. Maybe a bump once a year, maybe not even that. Then owners wonder why profitability feels impossible to pin down while labor costs shift every quarter, retail margins get buried under service revenue, and nobody actually knows if that new de-shedding treatment makes money once you account for the extra 25 minutes it adds to every appointment.
The disconnect between pricing decisions and real profit shows up everywhere. Your highest-priced premium package might actually lose money once you factor in product costs and groomer time. That retail shelf eating up half your waiting area? Could be generating negative returns when you include carrying costs. The junior groomer you just hired at $18/hour might actually be more profitable than your $25/hour senior—depending on speed and rebooking rates.
What grooming salons need isn't another pricing spreadsheet. They need a repeatable system that connects all the moving parts—service pricing, labor allocation, retail margins, capacity constraints—into something you can actually execute month after month without it falling apart.
The Traditional Approach Creates Blind Spots
Traditional salon pricing follows a predictable pattern. Check what competitors charge, add or subtract five bucks based on gut feel, hope it works. When margins feel tight, owners react in one of three ways: raise prices across the board, cut groomer hours, or push retail harder. Each reaction creates its own cascade of problems.
Across-the-board price increases often backfire because not all services have equal elasticity. Nail trim customers might disappear over a $2 increase while full-groom clients won't blink at $10 more. Cutting groomer hours reduces capacity right when you need revenue most. Pushing retail without understanding per-SKU profitability just moves inventory that might already be losing money.
But the real issue runs deeper. Most salons operate with fragmented data—service revenue lives in the booking system, product costs in QuickBooks, labor hours in payroll software, retail inventory somewhere else entirely. Even salons with decent data rarely connect it into anything actionable.
This fragmentation means owners make critical profitability decisions based on incomplete pictures. You might celebrate hitting $45,000 in monthly revenue without realizing your actual margin dropped three percentage points because your service mix shifted toward labor-intensive breeds. Or you stock up on that "popular" shampoo without knowing it generates half the margin of the slower-moving conditioner sitting next to it.
Building Your 30-Day Sprint Framework
A grooming salon profitability system that actually works needs to do three things: connect previously siloed data, create testable hypotheses, and measure results fast enough to course-correct. The 30-day sprint structure provides exactly this.
Never miss a grooming appointment again.
Furlyly helps you book, confirm, and manage every pet grooming appointment effortlessly.
- Unified appointment scheduling
- Automated client reminders
- Staff availability & shift management
No credit card required
Think of each sprint as a controlled experiment with clear inputs, measurable outputs, and decision rules that trigger specific actions. Unlike annual planning that tries to predict twelve months out, sprints let you test, learn, and adjust based on real customer behavior and real operational constraints.
The sprint framework divides into four weekly checkpoints:
Week 1: Baseline and Hypothesis Pull together your current state metrics across services, labor, and retail. Actual service times by type, true labor costs including overhead allocation, landed costs for retail products. From this baseline, form one specific hypothesis to test. Maybe it's "increasing bath-only prices by $8 will maintain volume while improving margins" or "shifting two afternoon slots to morning will increase capacity utilization."
Week 2: Implementation and Initial Tracking Execute your change and track leading indicators daily. For pricing changes, watch booking patterns and cancellation rates. For service mix adjustments, monitor groomer productivity and overtime. For retail experiments, track not just sales but questions asked and browsing behavior.
Week 3: Pattern Recognition By week three, patterns start to emerge. That price increase might show full acceptance Tuesday through Thursday but resistance on weekends. The morning slot shift might work great for senior groomers but cause problems for part-timers with school pickup commitments. These patterns inform your decision rules.
Week 4: Decision and Documentation Make your call: keep, modify, or revert. Document not just what happened but why—which customer segments responded, which didn't, what operational constraints appeared. This becomes your playbook for future experiments.
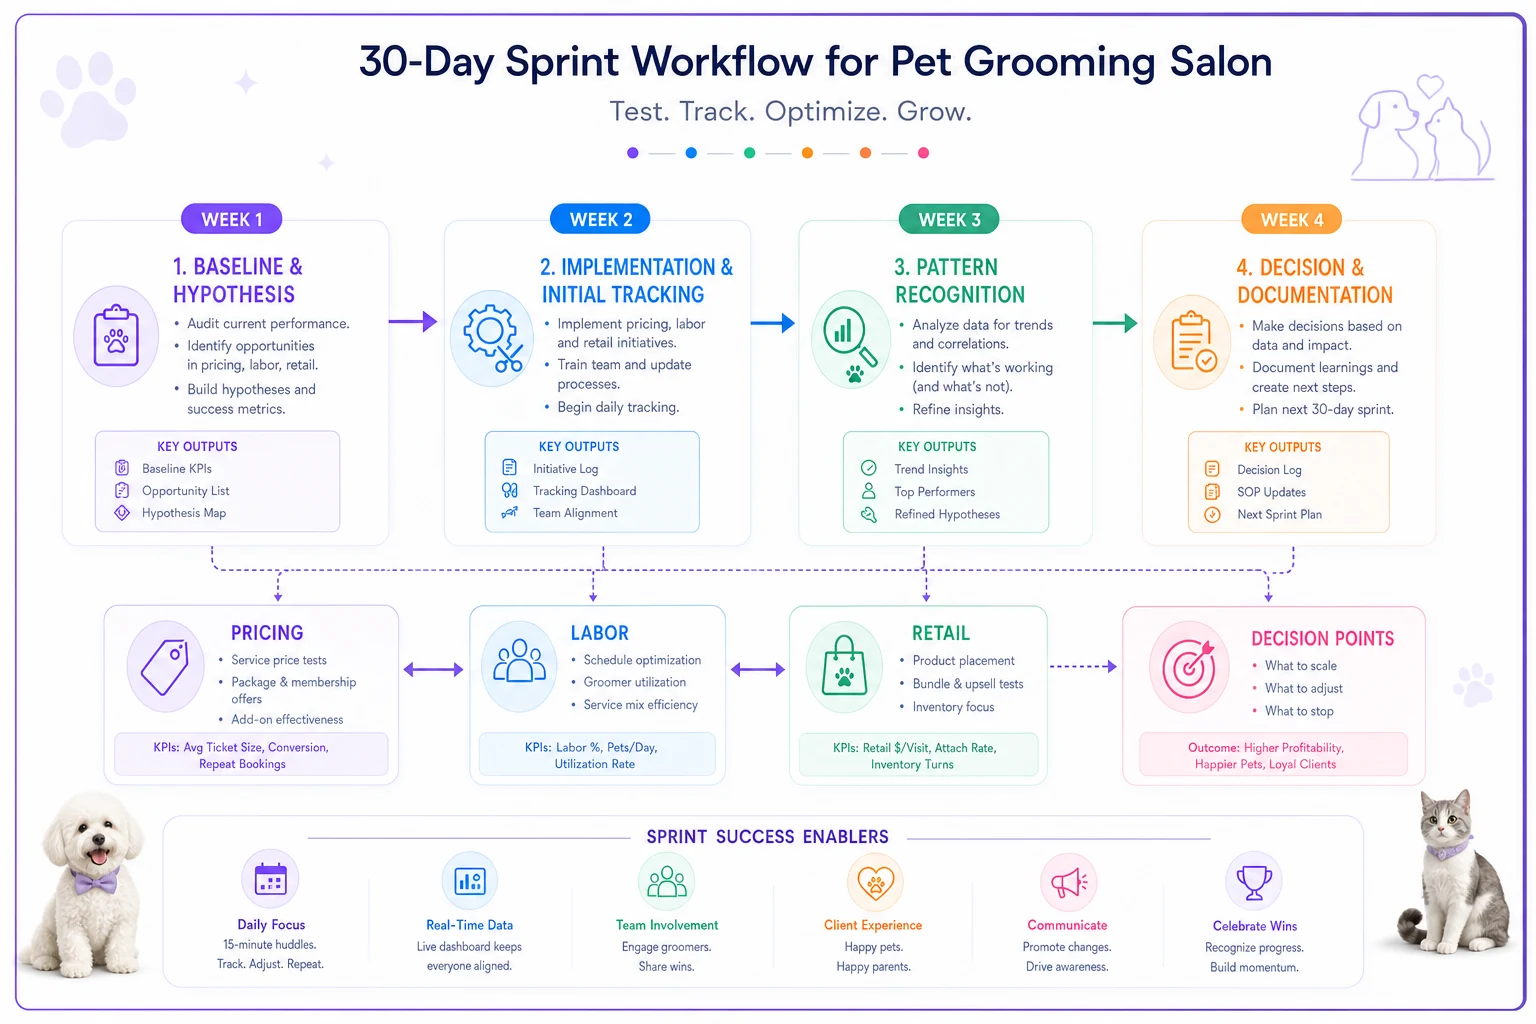
A simple visual like this keeps the sprint steps and key tracking points easy to follow for the team.
Service Architecture Deep Dive
Service pricing involves layers most owners never fully unpack. The posted price is just one variable in an equation that includes time, skill requirements, product usage, equipment wear, and opportunity cost.
Start by mapping your true service times—not the booking slots. A "45-minute" bath and tidy might actually take 55 minutes door-to-door once you include intake, moving between stations, and checkout. These hidden minutes compound fast. Six appointments with ten extra minutes each equals an entire lost appointment slot per day.
Next, calculate genuine labor costs per service. This means more than hourly wages. Include employer taxes, workers comp (which runs higher for grooming than most industries), and allocated overhead. A groomer making $20/hour actually costs closer to $28/hour when you factor everything in. Then add complexity multipliers—senior groomers handle difficult dogs faster, but they also expect the premium bookings that could go to profitable junior groomers.
Product costs vary dramatically by service type. A basic bath might use $3 in shampoo and conditioner, while a de-matting job could burn through $8 in products plus blade sharpening costs. Track actual usage for one full week. You'll probably discover certain services consistently run over on product use while others come in under.
Equipment depreciation almost never factors into service pricing, but it should. A $2,000 hydraulic table with maybe 8,000 grooms in its lifetime works out to $0.25 per groom. Your high-velocity dryer costing $400 might last 2,000 uses—$0.20 per dog. Small numbers individually, but they compound into real margin differences across services.
Labor Allocation Rules
Labor represents 35-45% of revenue in most grooming salons, making it the largest controllable expense. Yet most salons manage it reactively—scheduling based on who's available rather than who's most profitable for specific appointment types.
Groomer productivity varies more than owners realize. Track grooms per hour by groomer and service type for one full month. You'll likely find 30-40% variation between your most and least efficient team members on identical services. Slower groomers aren't automatically a problem—they might excel with difficult dogs or generate higher retail attachment. But it does mean you need to match groomer strengths to appropriate bookings.
Build a simple allocation matrix:
| Groomer Level | Best For | Avoid | Target Utilization |
|---|---|---|---|
| Senior (3+ years) | Difficult breeds, anxious dogs, special cuts | Basic baths, nail trims | 80-85% |
| Mid-level (1-3 years) | Standard grooms, repeat clients | First-time puppies, matted coats | 85-90% |
| Junior (<1 year) | Bath dogs, simple breeds, nail/teeth add-ons | Aggressive dogs, show cuts | 75-80% |
This matrix becomes your scheduling guide. When a Goldendoodle books online, route to mid-level groomers first. New puppy calling in? Juniors get priority. Regular client with an anxious dog wanting their usual groomer? That trumps efficiency metrics.
The utilization targets matter too. Senior groomers need buffer time for the unexpected complexity that comes with difficult assignments. Juniors need slightly lower utilization to account for learning curves. Push utilization too high and quality drops, leading to rework and unhappy customers.
Retail Margin Optimization
Retail in grooming salons sits in a weird middle ground—not core to operations but too significant to ignore. Most salons generate 8-15% of revenue from retail, but margins range wildly from negative to 60%+ depending on product selection and pricing strategy.
The fundamental problem is that owners treat salon retail like a grocery store when it actually functions more like airport shopping. Customers aren't price-comparing on their phones while waiting. They're making impulse decisions based on groomer recommendations or solving an immediate problem. That changes the margin optimization game entirely.
Start with landed cost analysis for every SKU. Wholesale price plus shipping, divided by units, plus roughly $0.50 per item for handling and shelf space. That $8 wholesale shampoo arriving in a case of 12 with $15 shipping actually costs $9.25 landed. If you price at the "standard" 2x markup to $16, you're making 42% margin, not 50%.
But velocity-adjusted margins matter more. A high-margin product that turns once per quarter generates less profit than a moderate-margin item that sells weekly. Calculate margin dollars per linear foot of shelf space per month. That premium organic shampoo might have great margins, but if it sits for two months, it's quietly destroying value.
Groomers are the key to retail success, but most salons bungle the incentive structure. Flat commissions on retail—typically 10-15%—encourage pushing high-price items regardless of margin or customer fit. Instead, tier commissions based on margin contribution:
-
Products under 30% margin
5% commission
-
Products 30-50% margin
10% commission
-
Products over 50% margin
15% commission
Calculate margin dollars per linear foot of shelf space per month to prioritize SKUs.
This aligns groomer incentives with salon profitability while still rewarding actual sales effort.
The Waterfall Decision Table
The most useful tool in your sprint system is a waterfall decision table that connects changes to their cascading impacts. Most pricing decisions create ripple effects across the operation, and understanding these in advance prevents expensive surprises.
Here's how a waterfall table works for a typical pricing experiment:
Primary Change: Increase full groom price by $10
First-Order Effects:
-
Revenue per appointment increases $10
-
Conversion rate on quotes might drop 5-8%
-
Booking velocity could slow by a day or two
Second-Order Effects:
-
Lower conversion means more open slots
-
Open slots enable same-day bookings at premium rates
-
Groomers might gravitate toward faster, lower-priced services
-
Customer lifetime value might increase if price signals quality
Third-Order Effects:
-
Schedule gaps could reduce groomer hours (labor savings)
-
Premium positioning might increase retail attachment
-
Staff morale could improve with less schedule pressure
-
Word-of-mouth might shift toward quality over price
Building these waterfalls before implementing changes helps you prepare for the full range of outcomes and identifies leading indicators worth tracking during the sprint.
Creating Experiment Templates
Reproducible experiments require standardized templates—not just what to change, but how to measure success. Without templates, every sprint becomes a one-off exercise that doesn't build institutional knowledge.
Hypothesis Statement: Specific, measurable, and time-bound. Not "raise prices to increase profit" but "increasing weekend bath-only prices by $12 will maintain 90% of volume while improving Saturday margins by 3 percentage points."
Success Metrics: Primary metric (margin improvement) plus guardrail metrics (customer retention, groomer satisfaction, booking velocity). Define acceptable ranges for each guardrail—losing 5% of bath-only customers might be acceptable if margins improve enough.
Implementation Checklist: Every step required to execute, from updating the booking system and price sheets to training staff on explaining changes. Include rollback procedures if results go sideways.
Data Collection Plan: What gets tracked, how often, and by whom. Daily metrics might include bookings, cancellations, and complaints. Weekly metrics could cover groomer productivity and retail attachment. Monthly metrics sum up margin impact and customer cohort behavior.
Decision Tree: Pre-determined actions based on results. If margins improve >3% with <5% volume loss, make it permanent. If margins improve <3% but volume drops >8%, revert. If results are mixed, extend the experiment for another sprint with modifications.
Sprint Cadence in Practice
Running monthly sprints sounds good in theory. Execution often stumbles on coordination and communication.
Pick a consistent sprint schedule—first Monday of each month works well since it aligns with monthly reporting. Block two hours for sprint planning to review last month's results and set up the new experiment. This isn't a casual check-in; it's a working session with data, templates, and specific decisions getting made.
During the sprint, establish daily and weekly check-ins. Daily can be as simple as a five-minute standup covering yesterday's numbers and today's focus. Weekly reviews dig deeper into patterns and potential adjustments. Keep these tight and focused on the experiment, not general operations.
Communication with staff requires balance. They need enough context to execute properly but not so much that every price change turns into a philosophical debate. Frame experiments as "testing to serve customers better" rather than "squeezing more margin." Share results that affect them directly—if higher prices mean steadier schedules, make sure they know.
The discipline comes from sticking to the sprint timeline even when early results look rough. Unless something truly catastrophic happens—mass cancellations, staff revolt—let experiments run their full course. Early indicators often mislead. What looks like customer pushback in week one might just be an adjustment period.
Document everything, including failed experiments. Especially failed experiments. Knowing that Sunday price increases caused mass defections saves you from trying it again six months later with a slightly different rationale. Build a simple repository of past experiments with results, learnings, and market context.
Margin Sprint Example
Here's a real sprint that shows how all these pieces connect.
The salon had 18 employees, three locations, and roughly $125,000 in monthly revenue. Margins had been sliding for six months despite steady top-line growth. The owner suspected the issue was service mix shifting toward lower-margin offerings but had no clear data to confirm.
Week 1 Analysis revealed the problem wasn't service mix—it was service definition. Their "Premium Groom" package included extras that pushed service time to 90 minutes while only charging $15 more than the 60-minute standard groom. After factoring in true labor costs, the premium package generated lower margins despite the higher price tag.
Week 2 Implementation meant updating the online booking system, training reception on positioning the changes, and coaching groomers on upselling the now-separate add-ons. Initial pushback came from senior groomers who liked the comprehensive package format, but they came around when they realized faster turnover meant more appointments and higher daily earnings.
Week 3 Patterns showed interesting segmentation. Regular premium customers mostly accepted the change, with about 60% adding at least one extra service. New customers actually preferred the modular approach—it felt like customization rather than being forced into a bundle. Total average ticket stayed flat while service time dropped about 18 minutes on average.
Week 4 Results: Margin on premium packages improved 4.2 percentage points. Groomer productivity increased 12% measured by services completed per day. Customer complaints stayed under 2%. The change was made permanent with minor tweaks to add-on pricing based on attachment rates.
The sprint generated roughly $3,800 in additional monthly profit from margin improvement alone, plus capacity gains that enabled $6,200 in additional monthly bookings. The groomer pay structure was adjusted to share some of those gains, which helped retention.
Integration with Existing Operations
The sprint system can't exist in isolation. It needs to mesh with seasonal planning, staff scheduling, and inventory management without creating a whole new layer of administrative overhead.
Start by aligning sprints with your existing monthly cycles. If you do inventory counts on the last day of the month, use that data for retail experiments. If payroll runs biweekly, coordinate labor experiments with pay periods to simplify tracking. Leverage existing data collection wherever possible.
Build buffer zones around predictable busy periods. Don't run pricing experiments the week before Christmas or service mix tests during spring break. Baseline data gets skewed and staff bandwidth is already stretched. Use these periods for planning and documentation instead.
Let sprint results guide operational improvements, not the other way around. A successful labor allocation experiment might reveal the need for better scheduling software. A retail margin sprint could expose inventory management gaps. That's a much better reason to invest in new tools than buying software and hoping it helps.
Train managers to think in sprint cycles when approaching problems. Instead of immediately implementing solutions, frame them as hypotheses to test. This builds discipline around measurement and prevents knee-jerk reactions that often make things worse.
Most importantly, keep the system lightweight. The moment it feels like bureaucracy, adoption drops. Templates should take 20 minutes to complete. Data collection should use existing systems where possible. Reviews should be focused and actionable.
Common Sprint Failures
Even well-designed sprints fail for predictable reasons.
The most common is hypothesis creep—starting with a clear experiment and then adding "just one more thing" until you're testing five variables at once. A sprint testing whether to raise nail trim prices by $3 somehow becomes a test of pricing, scheduling, and product changes simultaneously. When results come in, you can't isolate what actually drove the outcome.
Measurement fatigue kills more sprints than bad results. Asking staff to track twelve new metrics daily guarantees non-compliance by week two. Start with the minimum viable metrics—usually three to five numbers that directly connect to your hypothesis.
Premature optimization happens when early positive signals trigger immediate expansion. Week one shows good response to higher weekday prices, so you immediately raise weekend prices too. Now you're testing two things and can't tell the difference between customer acceptance of the increase versus day-of-week sensitivity.
Communication breakdown between shifts or locations muddles results. The morning shift implements the new service flow while evening staff reverts to old habits. Location A follows the new pricing while Location B forgets to update their system. Standardize communication with written protocols and verify implementation across all customer touchpoints before calling the sprint live.
The sunk cost fallacy shows up when experiments produce negative results but owners push forward anyway because they've "already invested two weeks." The entire point of experiments is learning. Negative results are valuable. Killing a bad idea after two weeks saves you from months of degraded performance.
Turning Sprints into Strategy
Individual sprints generate tactical improvements, but the real value comes from connecting them into strategic themes. After six months of sprints, patterns emerge that inform larger decisions.
Maybe pricing experiments consistently show customers value convenience over cost—they'll pay a premium for same-day booking, mobile service, or extended hours. That insight might justify investing in online scheduling infrastructure or a mobile unit.
Or perhaps labor experiments reveal your best margins come from junior groomers handling high-volume basic services while seniors focus on complex cases. That could reshape your entire hiring strategy, training programs, and service menu.
The cumulative data from sprints builds what you might call a margin map of your business—an understanding of which combinations of services, staff, timing, and customers generate the highest returns. That map guides everything from marketing spend to expansion decisions.
Review strategic insights quarterly. Look across three months of sprints and identify recurring themes. What types of changes consistently work? What never works regardless of how it's implemented? Which customer segments respond most favorably to experiments? These meta-learnings often end up more valuable than any individual sprint result.
Building a grooming salon profitability system isn't about complex financial modeling or enterprise-level analytics. It's about creating a simple, repeatable process that connects pricing, labor, and retail decisions into testable experiments with measurable outcomes.
The 30-day sprint framework provides exactly this—long enough to see real patterns, short enough to course-correct before damage compounds. By systematically testing hypotheses, documenting results, and building decision rules, you transform profitability from something you hope for into something you engineer.
Salons that implement this approach consistently see margins improve by 3-7 percentage points within six months. More importantly, they develop the habit of continuous experimentation. Problems become hypotheses, solutions become experiments, results become institutional knowledge.
Start with one sprint. Pick something specific—maybe testing whether your slowest-moving retail SKUs are actually destroying value, or whether shifting two appointment slots earlier could reduce overtime. Run the full 30-day cycle. Document everything. Then do it again with a new hypothesis.
The compound effect of monthly margin improvements transforms salon economics over time. A 0.5% monthly margin gain becomes 6% annually. That's the difference between barely breaking even and building real equity value in your business.
The tools don't need to be perfect. They just need to be good enough to start, consistent enough to maintain, and simple enough that your team actually uses them. From there, the system improves itself through repetition and results.
Your salon's profitability isn't determined by market conditions or what customers are willing to pay. It's determined by thousands of small decisions about pricing, staffing, and inventory. The sprint system makes those decisions visible, testable, and over time, profitable.
Ready to streamline your grooming business?
Join 500+ pet groomers using Furlyly to save time, reduce scheduling conflicts, and deliver exceptional client experiences.