



If you've already settled on your six operational numbers, you've done the hard conceptual work. The problem now is quieter and more annoying: two people pull the "same" metric and get two different answers. Your front desk counts a Saturday no-show as a cancellation. Your POS counts a deposit-only booking as revenue. One report includes retail in average ticket, another doesn't. Suddenly your "rebook rate" means three different things depending on what day someone exports it.
This is a counting-rules problem, not a strategy problem. So this piece skips the "why these six metrics matter" conversation — if you need that foundation, the minimal KPI dashboard breakdown covers thresholds and corrective triggers. What follows is the boring, exact stuff: numerators, denominators, what to include, what to throw out, the sheet formulas, the SQL and API field names for the booking systems you're probably on, and a timed morning routine that actually fits in seven minutes.
The six metrics, defined to the cell
The reason these numbers drift is almost always an undefined edge case. A dog shows up 40 minutes late and gets squeezed in — is that an on-time arrival? A client books two pets on one appointment — is that one booking or two? Nobody wrote it down, so each person guesses, and the guess changes.
These are the counting rules worth locking down before touching a spreadsheet.
| Metric | Numerator | Denominator | Include | Exclude |
|---|---|---|---|---|
| Utilization % | Billed groomer-minutes | Available groomer-minutes (scheduled shift minus breaks) | Actual service time, buffer if client-caused | Unpaid breaks, closed days, admin blocks |
| Average Ticket | Total service + add-on revenue | Count of completed appointments | Add-ons, upcharges | Retail products, tips, gift-card sales, tax |
| Rebook Rate | Clients with a future appointment booked | Clients who completed a groom in the period | Rebooked at checkout or within 7 days | No-shows, first-time cancellations |
| No-Show Rate | Appointments marked no-show | Total confirmed appointments | True no-shows, same-day no-contact cancels | Salon-initiated reschedules, weather closures |
| Retail Attach % | Appointments with ≥1 retail item | Total completed grooming appointments | Any physical product sale | Gift cards, tips, service add-ons |
| Revenue per Available Hour (RevPAH) | Total service revenue | Total available groomer-hours | All billable service revenue | Retail, tips |
-
Multi-pet appointments count as one booking but multiple serviced pets. Decide once. The cleaner approach is counting the appointment for no-show and rebook math, and the pet only for utilization and revenue. Mixing these is the single most common reason the numbers don't add up.
-
Deposits are not revenue until the service completes. A $20 deposit on a booking next Tuesday should never hit today's average ticket. This is the second most common inflation source.
-
Salon-initiated reschedules are not no-shows. If your groomer called out and you moved 11 dogs, those aren't client no-shows. Tag them separately or your no-show rate lies to you every time someone's sick.
The pattern that keeps showing up: salons that do have definitions still leave the inclusion/exclusion list blank. The definition says "rebook rate = clients who book again," but nobody specified the window. At checkout? Within 30 days? Ever? Without the window, the number is unfalsifiable.
The Google Sheet layout (with the formulas that actually matter)
You don't need a fancy BI tool for six metrics across a dozen groomers. A single sheet with three tabs does it.
Never miss a grooming appointment again.
Furlyly helps you book, confirm, and manage every pet grooming appointment effortlessly.
- Unified appointment scheduling
- Automated client reminders
- Staff availability & shift management
No credit card required
Tab 1 — raw_appointments (one row per completed appointment, pasted or synced daily):
| Column | Field |
|---|---|
| A | appointment_date |
| B | appointment_id |
| C | client_id |
| D | groomer |
| E | status (completed / noshow / cancelled / rescheduledby_salon) |
| F | service_revenue |
| G | retail_revenue |
| H | scheduled_minutes |
| I | actual_minutes |
| J | futurebookingflag (TRUE/FALSE) |
Tab 2 — daily_rollup. This is where the formulas live. Assuming today's date sits in A2:
-
Average Ticket (completed only) =SUMIFS(rawappointments!F:F, rawappointments!A:A, A2, rawappointments!E:E, "completed") / COUNTIFS(rawappointments!E:E, "completed", raw_appointments!A:A, A2)
-
No-Show Rate =COUNTIFS(rawappointments!A:A, A2, rawappointments!E:E, "noshow") / COUNTIFS(rawappointments!A:A, A2, rawappointments!E:E, {"completed";"noshow"}) (The denominator excludes salon reschedules — that's the whole point.)
-
Rebook Rate =COUNTIFS(rawappointments!A:A, A2, rawappointments!E:E, "completed", rawappointments!J:J, TRUE) / COUNTIFS(rawappointments!A:A, A2, raw_appointments!E:E, "completed")
-
Retail Attach % =COUNTIFS(rawappointments!A:A, A2, rawappointments!E:E, "completed", rawappointments!G:G, ">0") / COUNTIFS(rawappointments!A:A, A2, raw_appointments!E:E, "completed")
-
Utilization % (sum actual over scheduled for the day)
=SUMIFS(rawappointments!I:I, rawappointments!A:A, A2, rawappointments!E:E, "completed") / <availableminutesforthat_day>
Tab 3 — rolling averages. This is the part most salons skip, then wonder why their numbers feel jumpy. One rainy Tuesday wrecks a daily no-show rate. Rolling windows smooth that out. If your daily_rollup has dates in column A and the metric in column B:
-
7-day rolling =AVERAGEIFS(dailyrollup!B:B, dailyrollup!A:A, ">="&A2-6, daily_rollup!A:A, "<="&A2)
-
28-day rolling same formula, swap
-6for-27. -
60-day rolling swap for
-59.
The 7-day catches sudden breaks — a groomer leaves, a referral source dries up. The 28-day is your real operating baseline. The 60-day is the trend you actually quote to yourself before making a pricing or staffing decision. Looking at only one window is how people panic over noise or miss a slow bleed entirely.
Keep the rolling formulas on their own tab so you can reference multiple windows without cluttering the daily_rollup logic.
The 7-day catches sudden breaks — a groomer leaves, a referral source dries up. The 28-day is your real operating baseline. The 60-day is the trend you actually quote to yourself before making a pricing or staffing decision. Looking at only one window is how people panic over noise or miss a slow bleed entirely.
Pulling the data: SQL and API field mappings
The sheet is useless if someone retypes 40 rows every morning. Here's how the common systems expose the fields.
Square (Bookings + Payments API). Square splits things annoyingly: the booking lives in the Bookings API, the money lives in Payments/Orders. You join on customer_id and the booking's time window.
-
Booking status
booking.status(ACCEPTED,CANCELLEDBYCUSTOMER,NOSHOW,CANCELLEDBY_SELLER) -
Map
CANCELLEDBYSELLER→ yourrescheduledbysalonso it drops out of the no-show denominator. -
Service revenue
sum
order.lineitemswhereitemtypeis a service catalog object; retail revenue is the rest. -
Rebook flag
query whether a future booking exists for that
customeridwithstartat > now().
Mindbody. Uses the GetClientVisits and GetSales endpoints.
-
Visit status via
Visit.SignedInandVisit.LateCancelled/Visit.WebSignup. -
Visit.ServiceIdseparates service from retail (retail comes throughSale.Products). -
No-show maps to the "Absent" status flag; late-cancel is a separate field. Whether late-cancels count as no-shows is worth deciding explicitly — same-day late-cancels usually belong in the no-show bucket, earlier ones don't.
Vagaro / Booker. Both are thinner on public API access; most salons end up on scheduled CSV exports.
-
Vagaro's appointment export gives you
Status,Service,Service Price,Product Total, andStaff— maps cleanly to columns E through J above. -
Booker exposes appointments and transactions through its API with
AppointmentStatusID; status 4 is typically no-show, but verify against your own account because these IDs get remapped.
A representative SQL shape once the data lands in a warehouse table:
SELECT appointmentdate, COUNT() FILTER (WHERE status = 'noshow')::decimal / NULLIF(COUNT() FILTER (WHERE status IN ('completed','noshow')), 0) AS noshowrate, AVG(servicerevenue) FILTER (WHERE status = 'completed') AS avgticket, COUNT() FILTER (WHERE status='completed' AND futurebookingflag) ::decimal / NULLIF(COUNT() FILTER (WHERE status='completed'), 0) AS rebookrate FROM appointments WHERE appointmentdate = CURRENTDATE - 1 GROUP BY appointment_date;
The NULLIF matters more than it looks. On a slow day with zero completed appointments, a naive divide throws an error and your whole automated report fails silently — which nobody notices until three weeks later.
Webhooks and the automation worth building first
Not everything should be automated at once. Start with events that are both high-frequency and high-error.
The single most valuable webhook for groomers is appointment status change → write a row. When Square, Mindbody, or Booker fires a booking.updated or equivalent, catch it, map the status through your inclusion rules, and append to the raw sheet or warehouse. That one hook kills the daily retyping and the "I forgot to log the no-show" gap.
Second most valuable: payment completed → attach retail flag. When the order closes, check whether it contained a retail line and set the attach flag. Doing it at payment time instead of nightly means your attach % is accurate the moment you look at it.
A workflow that holds up in practice:
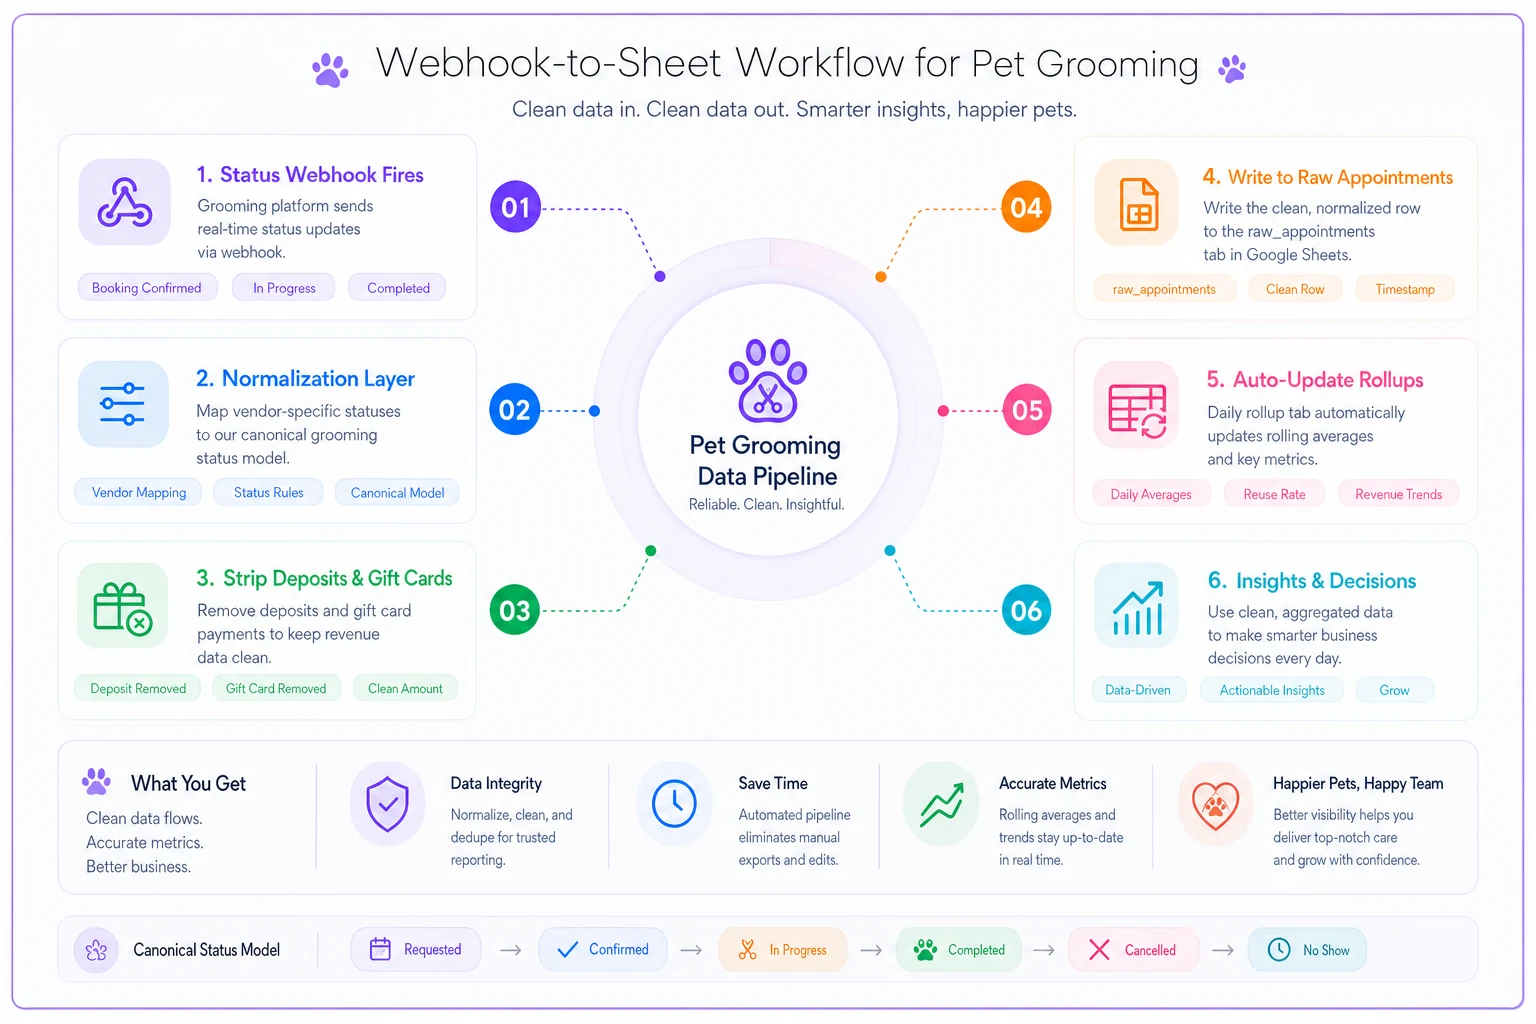
Quick visual of the webhook-to-sheet flow so engineers and operators align on the normalization step.
Status webhook fires ↓ Normalization layer maps vendor-specific statuses to your five canonical statuses ↓ Deposits and gift cards stripped before touching revenue ↓ Clean row written to rawappointments tab ↓ Rolling averages auto-update in dailyrollup tab
The normalization step is where most DIY setups break. People pipe the raw vendor status straight through and spend months wondering why Square's CANCELLEDBYSELLER is inflating their no-show rate. Salons running an operational platform with built-in sync get a quiet advantage here: normalization and dedup logic are already handled, so rolling averages compute against clean data instead of whatever the POS happened to label things. A serviceable version is absolutely buildable yourself with a couple of webhooks and the formulas above, but that normalization step needs to be explicit, not assumed.
Alert templates for each trigger
An alert should tell you what broke, how bad, and what to check — in one glance. Vague alerts get ignored. Here are tight templates.
Slack — No-show spike (7-day crosses threshold): > ⚠️ No-show rate 7-day = 14% (threshold 9%). Yesterday: 4 no-shows / 23 confirmed. Check: confirmation sends firing? New client cohort? — owner to review by 10am.
SMS — Utilization drop (groomer-level): > Util alert: [Groomer] at 61% 7-day (floor 72%). 2 open slots today. Fill or shift schedule.
Email — Average ticket decline (28-day): > Subject: Avg ticket 28-day down to $58 (baseline ~$66) > Add-on attach dropped to 18% from ~31%. Likely cause: fewer upsells at checkout. Review by Friday standup.
Slack — Rebook rate below floor: > 📉 Rebook rate 7-day = 41% (floor 55%). 9 of 22 completed grooms left without a next appointment. Front desk: confirm checkout rebook prompt is being used.
Slack — Retail attach below floor: > Retail attach 7-day = 12% (floor 20%). Review front desk product conversation at checkout.
Every alert carries the current value, the threshold it broke, the raw counts behind it, and a who-does-what-by-when. An alert without a counts line gets dismissed as noise because nobody can sanity-check it on the spot.
The 7-minute morning snapshot routine
The point of a morning snapshot isn't to analyze — it's to catch the one thing that will cost you money today if you ignore it. Analysis happens weekly. Mornings are triage.
-
(0
00–1:00) Owner/manager — open the rolling dashboard.
Glance at the 7-day column for all six metrics. You're only looking for anything in red. -
(1
00–2:30) Check no-show and utilization first.
These two cost money today. If no-show 7-day crossed its floor, confirm today's confirmations went out. If a groomer's utilization is low, look at today's gaps before the day starts. -
(2
30–4:00) Scan today's schedule against capacity.
Open slots that can still be filled? Flag the front desk to run a waitlist text. Double-booked buffers? Fix now, not at 2pm. -
(4
00–5:30) Rebook and attach — front desk ownership.
Did yesterday's completed grooms rebook? If the rate's low, the front desk gets a reminder to use the checkout prompt today. This is a nudge, not an analysis. -
(5
30–6:30) Revenue sanity check.
Does yesterday's average ticket look normal against the 28-day? A big dip usually means a logging error — retail counted as service, or a deposit miscoded. Catch it now while yesterday is still fresh. -
(6
30–7:00) Log any anomaly and assign it.
One line in a shared note: what's off, who owns it, by when. Close the laptop.
SLA escalation matrix — so a flagged problem doesn't just sit:
| Trigger | First responder | Response SLA | Escalates to | If unresolved |
|---|---|---|---|---|
| No-show 7-day > floor | Front desk | Same day | Manager | 48 hrs → owner reviews confirmation flow |
| Utilization < floor (groomer) | Manager | Same day | Owner | 3 days → schedule/pay review |
| Avg ticket dip > 10% | Manager | Next business day | Owner | 1 week → audit logging + upsell SOP |
| Rebook < floor | Front desk | 2 days | Manager | 1 week → checkout script retrain |
| Retail attach < floor | Front desk | 3 days | Manager | 2 weeks → merchandising review |
The escalation column is what makes this stick. Without it, every flag lands on the owner and the owner becomes the bottleneck for six metrics. With it, most issues resolve one level down and only the stubborn ones climb.
When to automate this — and when not to bother
Automating the sync and alerts makes sense once you're past roughly 150–200 appointments a month, or the moment more than one person is pulling reports. Below that, a two-minute daily manual paste into the sheet is fine — and you'll understand your data better for having touched it.
Where automation is a bad idea: if your statuses aren't clean yet. Automating a messy status taxonomy just produces wrong numbers faster and with more confidence. Fix your inclusion/exclusion rules and get two weeks of hand-checked data first. Then wire the webhooks. Automating on top of undefined rules is how salons end up with a beautiful dashboard that everyone has quietly stopped trusting.
If you're a single-groomer shop where you are the front desk, the escalation matrix is overkill. Keep the morning snapshot, drop the SLA table, and revisit when you hire a second person.
Real scenario
A two-van, three-groomer mobile operation was arguing every month about their no-show rate. The owner's export said 6%; the lead groomer's said nearly 13%. Both were technically right — the owner's booking software was lumping salon-initiated reschedules (weather, van breakdowns) in with no-shows, while the groomer was only counting client no-contact cancels.
They spent an afternoon writing out the inclusion/exclusion rules above, added a rescheduledbysalon status, and updated the no-show formula to exclude it from the denominator. Their true client no-show rate landed around 8%. More useful than the number itself: once the definition was fixed, confirmation-timing changes they'd made a month earlier finally showed a measurable drop — roughly two to three fewer no-shows per week — that had been completely masked by the counting noise before. Nothing about their operation changed that afternoon. Only the counting did, and suddenly the data was trustworthy enough to act on.
The thing to take away
Six metrics only help if everyone counts them the same way, every day, without thinking about it. The definitions table, the inclusion/exclusion rules, and the rolling-window formulas are the unglamorous layer that makes every downstream decision — pricing, staffing, confirmations — rest on numbers people actually believe.
Build the counting rules first, then the sheet, then the automation, in that order. Do it backwards and you'll have a dashboard nobody trusts and a morning meeting that turns into an argument about whose export is right.
Ready to streamline your grooming business?
Join 500+ pet groomers using Furlyly to save time, reduce scheduling conflicts, and deliver exceptional client experiences.